





Request, SQL query, log, and exception capture for ASP.NET Core, viewable in a dashboard at /_debug, and the hub of a small suite of local-first dev tools. Think Laravel Telescope, but for .NET.
Everything is stored locally in a LiteDB file. The dashboard ships inside the package as a single self-contained page, so there are no CDN dependencies and it works offline.
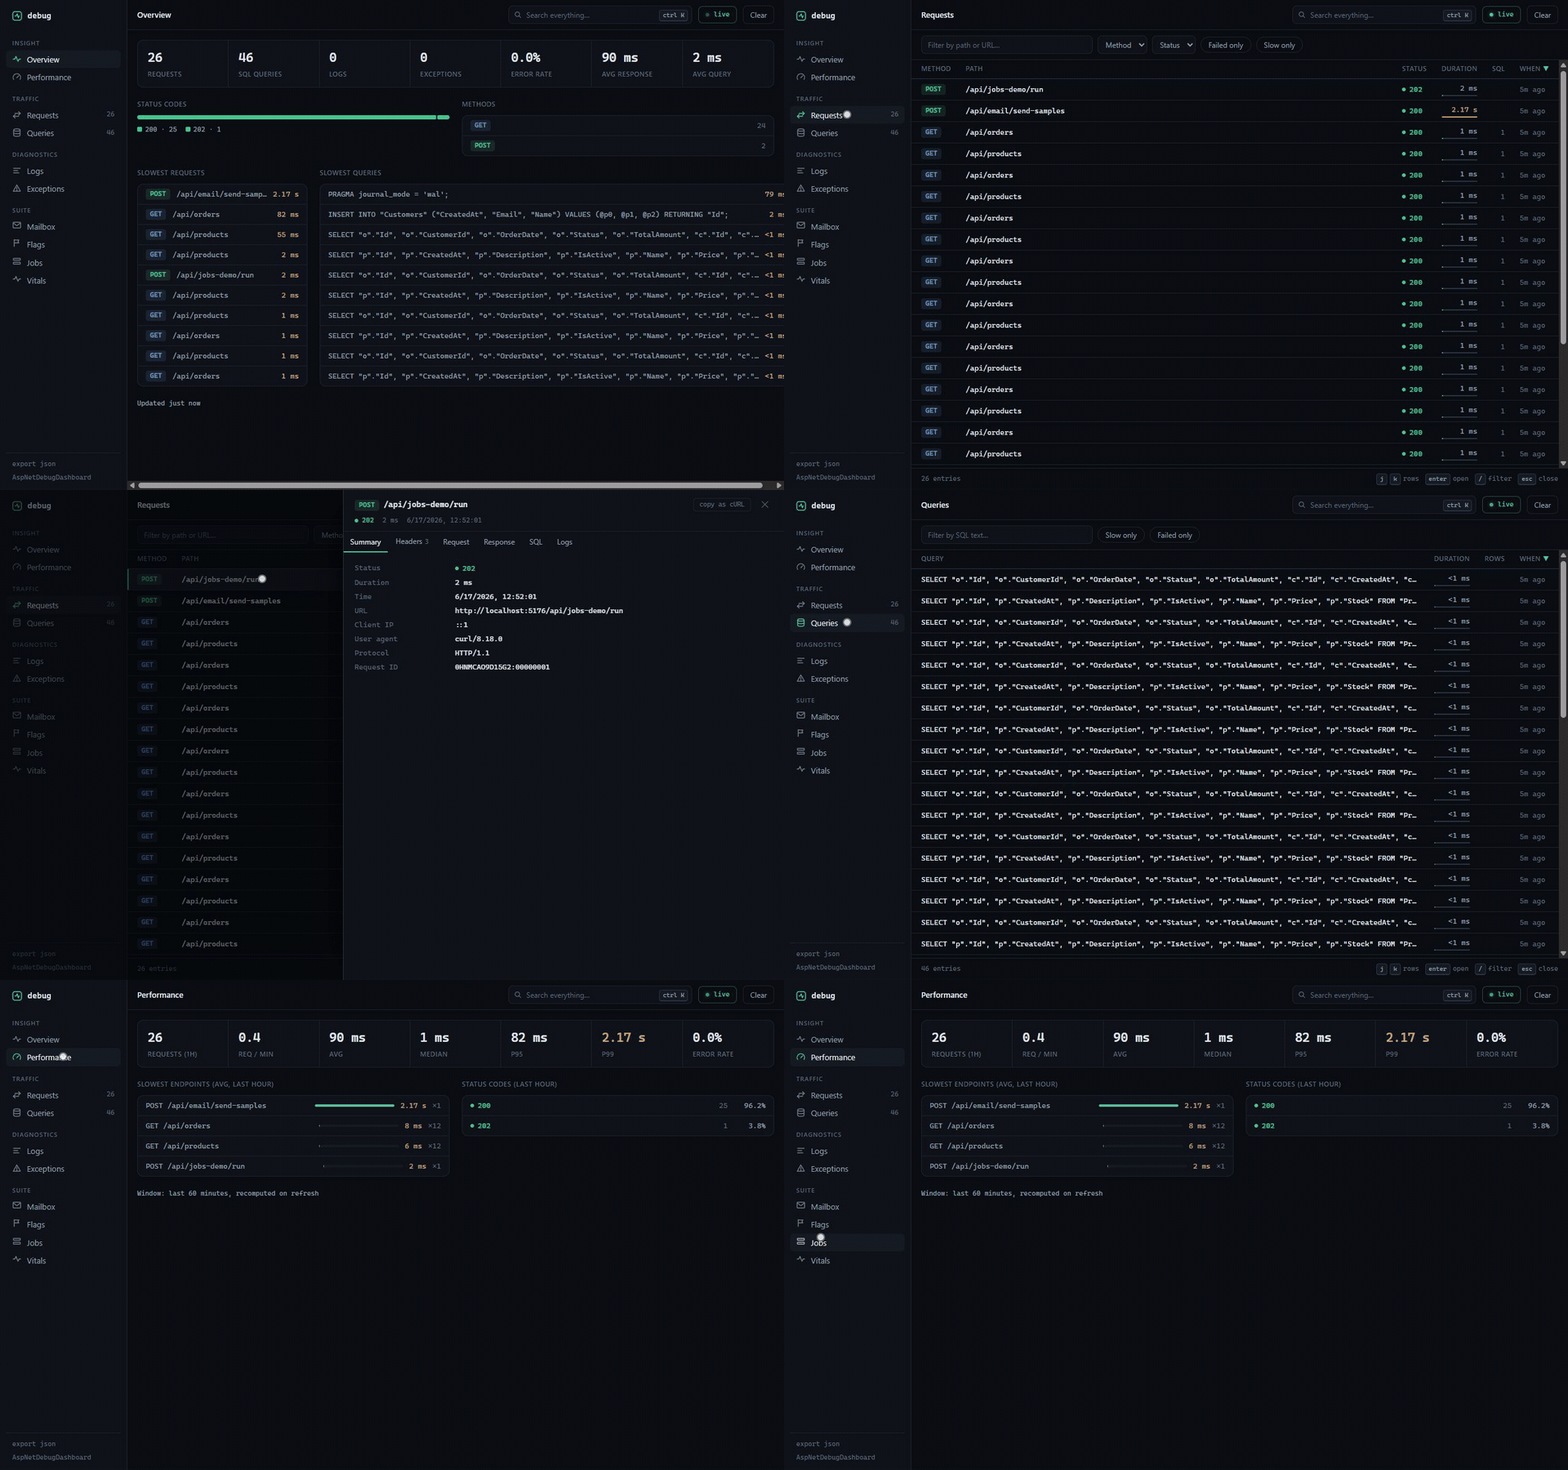
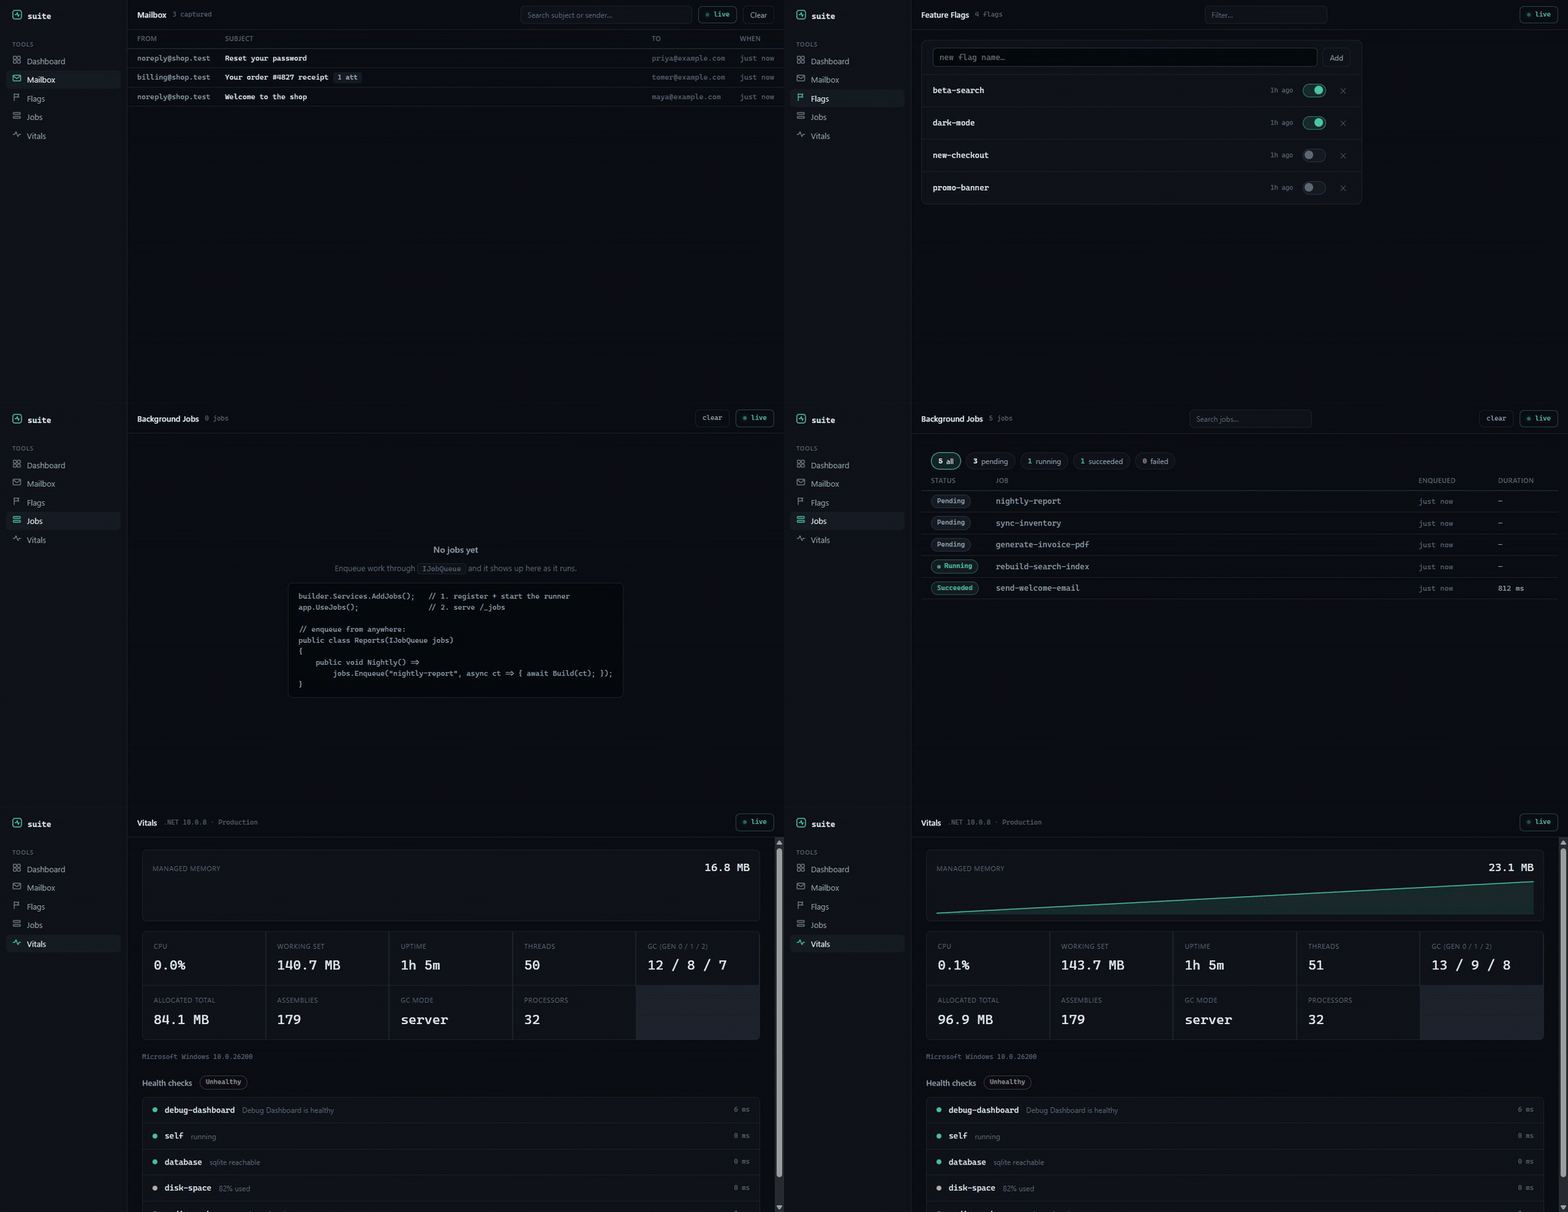
The dashboard is the hub of a set of local-first dev tools that follow the same recipe: install a package, get a self-contained page at a /_* route, no extra infrastructure. Each works on its own, and when more than one is installed they share a sidebar so you can move between them.
| Package | NuGet | Route | What it does |
|---|---|---|---|
| AspNetDebugDashboard | |
/_debug |
Request, SQL, log, and exception capture (this package). |
| AspNetMailbox |  |
/_mailbox |
Captures outbound email in-process and previews it (HTML, text, headers, attachments). No mail server. |
| AspNetFlags |  |
/_flags |
Feature flags with a toggle UI. Flags appear the first time your code checks them. |
| AspNetJobs |  |
/_jobs |
Background jobs that run in-process, with a live inspector showing status, timing, and stack traces. |
| AspNetVitals |  |
/_vitals |
Live memory, GC, threads, uptime, and your registered health checks on one page. |
There's also AspNetDebugDashboard.Mcp to expose all of it to an AI agent over MCP. Install only what you want; nothing else is pulled in.
dotnet add package AspNetDebugDashboardOr in the project file:
<PackageReference Include="AspNetDebugDashboard" Version="2.2.0" />Or from the Package Manager Console in Visual Studio:
Install-Package AspNetDebugDashboardWorks on .NET 8, 9, and 10. No other setup files, schemas, or services needed. Storage is an embedded LiteDB database created on first run.
The minimum is two lines:
using AspNetDebugDashboard.Extensions;

var builder = WebApplication.CreateBuilder(args);

builder.Services.AddDebugDashboard();          // 1. register services

var app = builder.Build();

app.UseDebugDashboard();                       // 2. add middleware (no-op outside Development)

app.MapControllers();
app.Run();
Run your app and open /_debug.
Attach the interceptor when registering your context:
builder.Services.AddDbContext<AppDbContext>((sp, options) =>
{
    options.UseSqlServer(connectionString);    // any relational provider
    options.AddDebugDashboard(sp);
});
Works with SQL Server, PostgreSQL, SQLite, MySQL, anything that goes through EF Core's relational pipeline. (UseInMemoryDatabase produces no SQL, so there's nothing to capture there.)
Inject IDebugLogger anywhere:
public class OrderService(IDebugLogger log)
{
    public async Task<Order> CreateAsync(CreateOrderRequest req)
    {
        await log.LogInfoAsync("Creating order", properties: new() { ["customerId"] = req.CustomerId });
        // LogWarningAsync, LogErrorAsync, LogSuccessAsync, or LogAsync(message, level)
    }
}
Or use the static logger where injection is awkward:
await DebugLogger.InfoAsync("Cache warmed", tag: "startup");Entries written during a request are attached to it, so the request detail shows the logs and queries it produced.
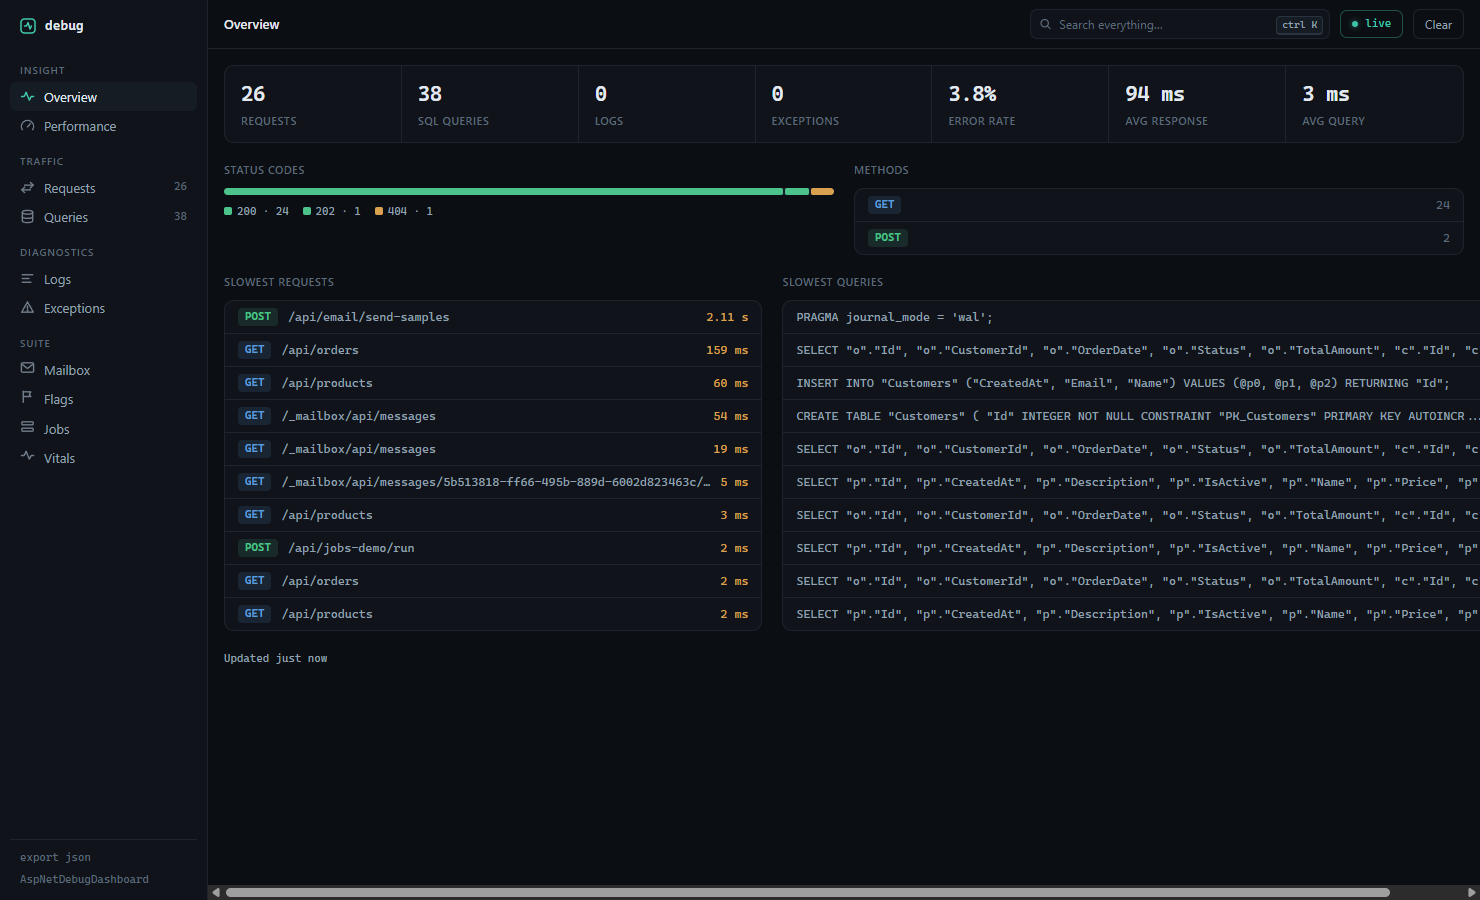
| Overview | totals, error rate, status/method distribution, slowest requests and queries |
| Performance | req/min, avg, median, P95/P99, error rate, slowest endpoints (last hour) |
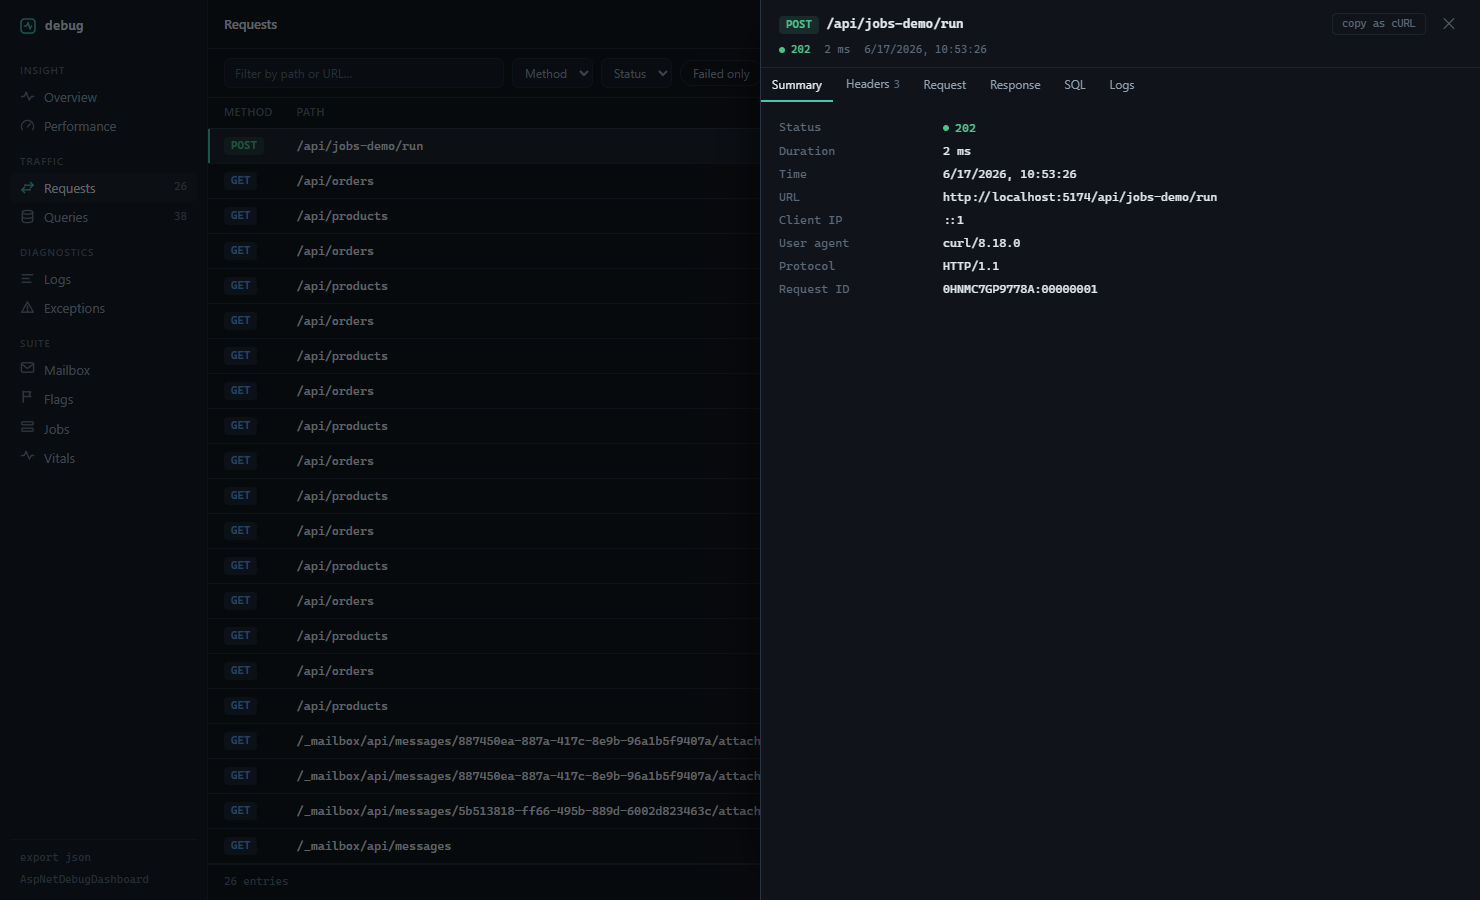
| Requests | sortable table with duration bars; detail has Summary / Headers / Request / Response / SQL / Logs tabs and a copy-as-cURL button |
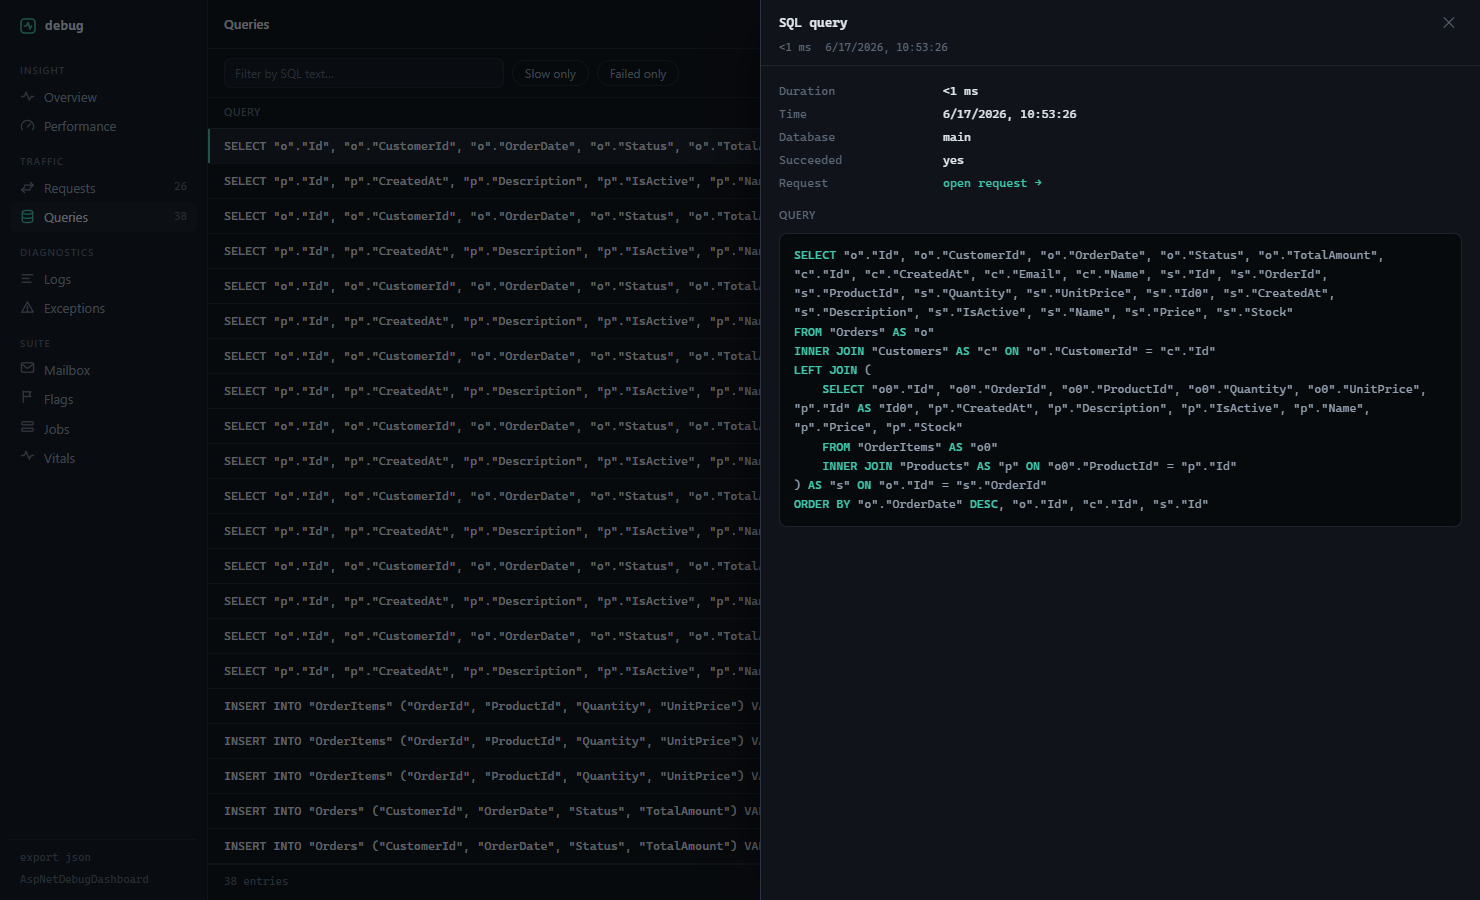
| Queries | full SQL with syntax highlighting, parameters, timing; slow queries flagged; an N+1 warning appears when one request runs the same query 3+ times |
| Logs | level, category, structured properties, stack traces |
| Exceptions | type, message, full stack trace, inner exceptions, the route that threw |
Global search (Ctrl+K) covers everything. Tables navigate from the keyboard: j/k rows, Enter open, / filter, Esc close. Queries, logs, and exceptions link back to their parent request.
All options, with their defaults:
builder.Services.AddDebugDashboard(options =>
{
    options.BasePath = "/_debug";              // dashboard route
    options.DatabasePath = "debug-dashboard.db";
    options.MaxEntries = 1000;                 // per entry type, oldest trimmed first
    options.LogRequestBodies = true;
    options.LogResponseBodies = false;
    options.MaxBodySize = 1024 * 1024;         // bodies above this are skipped
    options.SlowQueryThresholdMs = 1000;
    options.ExcludedPaths = new() { "/_debug", "/health" };
    options.ExcludedHeaders = new() { "Authorization", "Cookie", "Set-Cookie", "X-Api-Key", "X-Auth-Token", "Proxy-Authorization" };
    options.RedactedBodyFields = new() { "password", "secret", "token", "apikey" }; // matched case-insensitively against JSON and form field names
    options.AllowedEnvironments = new() { "Development" }; // "*" allows every environment
    options.AuthorizationFilter = null;        // Func<HttpContext, bool>, applied to UI + API
    options.RetentionPeriod = TimeSpan.FromDays(7);
});
Or bind from appsettings.json:
{
  "DebugDashboard": {
    "MaxEntries": 2000,
    "LogResponseBodies": true,
    "SlowQueryThresholdMs": 500
  }
}builder.Services.Configure<DebugConfiguration>(builder.Configuration.GetSection("DebugDashboard"));
builder.Services.AddDebugDashboard();The full reference is in docs/CONFIGURATION.md.
Captured requests and queries are also emitted as spans on an ActivitySource named AspNetDebugDashboard. Add that source to your tracer and they flow to Aspire, Jaeger, or any OTLP backend, alongside what the dashboard stores locally:
builder.Services.AddOpenTelemetry()
    .WithTracing(t => t
        .AddSource("AspNetDebugDashboard")
        .AddOtlpExporter());
The spans carry the request id, status, SQL text, and timing. They cost nothing until you add the source (no listener, no span), so the default is fine to leave on. Set EmitActivities = false to turn it off entirely. Details in docs/OPENTELEMETRY.md.


AspNetDebugDashboard.Mcp is a separate dotnet tool that exposes the captured data to a coding agent over MCP, so it can read recent requests, the SQL a request ran, recent failures, and performance numbers while it works on your app. If you've installed the rest of the suite, it can also read your feature flags, background jobs, vitals, and captured mail.
dotnet tool install --global AspNetDebugDashboard.Mcp{
"mcpServers": {
"debug-dashboard": {
"command": "aspnet-debug-mcp",
"env": { "DEBUG_DASHBOARD_URL": "http://localhost:5000" }
}
}
}Setup and the full tool list are in its README.
The dashboard's UI, API, and EF interceptor all check IsEnabled and the current environment against AllowedEnvironments (default: Development only) before doing anything, and they check it themselves rather than relying on UseDebugDashboard() being called a particular way. That holds even if MapControllers() is registered unconditionally, so requests outside an allowed environment get a 404 regardless of how the pipeline is wired.
If you want it on elsewhere (a staging box, say), opt in explicitly:
app.UseDebugDashboard(forceEnable: true);This enables the dashboard and adds the current environment to AllowedEnvironments. You can also set AllowedEnvironments directly in AddDebugDashboard, or use "*" to allow every environment.
If you enable it anywhere reachable from the internet, set AuthorizationFilter too:
services.AddDebugDashboard(options =>
{
    options.AuthorizationFilter = ctx => ctx.User.IsInRole("Admin");
});
It runs on every dashboard UI and API request and returns 401 when it returns false. Without it, the dashboard has no auth of its own, and captured request bodies can contain anything your users send (though known password/secret/token/apikey fields are redacted by default; see RedactedBodyFields).
The dashboard is a client of a plain JSON API you can also call directly:
| Endpoint | What it returns |
|---|---|
GET /_debug/api/stats |
totals and distributions |
GET /_debug/api/requests |
paged requests; supports search, method, statusCode, isSuccessful, minExecutionTime, sortBy, page |
GET /_debug/api/queries |
paged SQL queries; supports search, isSlowQuery, isSuccessful |
GET /_debug/api/logs |
paged logs; supports search, level |
GET /_debug/api/exceptions |
paged exceptions |
GET /_debug/api/performance |
last-hour metrics (P95/P99, error rate, slowest endpoints) |
GET /_debug/api/search?term= |
cross-type search |
GET /_debug/api/export |
everything as a JSON file |
POST /_debug/api/logs |
write a log entry over HTTP |
DELETE /_debug/api/clear |
wipe all captured data |
Full details in docs/API.md.
The repo ships a sample app with endpoints for generating traffic, slow operations, and test exceptions:
git clone https://github.com/eladser/AspNetDebugDashboard
cd AspNetDebugDashboard
dotnet run --project samples/SampleApp --urls http://localhost:5000
# hit a few endpoints, then open http://localhost:5000/_debug
curl http://localhost:5000/api/products
curl http://localhost:5000/api/products/slow-operation
curl http://localhost:5000/api/products/test-errorThe UI is a Vite + React app in dashboard/, compiled to one HTML file with everything inlined and embedded into the assembly. To work on it:
cd dashboard
npm install
npm run dev    # proxies /_debug/api to localhost:5000 (run the sample app alongside)
npm run build  # writes src/AspNetDebugDashboard/wwwroot/index.html
See CONTRIBUTING.md for the full dev loop.
If this tool saves you some debugging time, you can buy me a coffee.
MIT. See LICENSE.