
News▼
Rapidly build robust and professional diagrams, charts and rich graphical front ends using React.
Not using React?
- npm
- pnpm
- yarn
- bun
npm install @visuallyjs/browser-ui-react
pnpm add @visuallyjs/browser-ui-react
yarn add @visuallyjs/browser-ui-react
bun add @visuallyjs/browser-ui-react
read the full quickstart guide
Callflow
Callflow builder with rich node content


What will you build today?
Node based applications
Create components to render rich content and interactivity in your nodes and groups. Wire them up with a view and apply an automatic layout. VisuallyJs makes it a snap to build callflow designers, chatbot builders, kanban boards, automation flows, and so much more.


Diagrams
Render SVG shapes using shape libraries. Shrink, grow and rotate using our resizing tools. Drag new shapes onto your canvas from a palette. Everything you need to build world-class diagrams is available out of the box. Build flowcharts, BPMN editors, call flow builders, SCADA/HMI consoles, process flow diagrams, ERD editors, mindmaps and much more.
Charts
Full range of 2D charts - column, bar, area, line, scatter - plus pie charts, gauges and more specialized charts such as sankey.
Populate charts from standalone data or use the data model from an app or diagram for dynamically updated insights into your dataset.


Dashboards
Create a model and use it as the single source of truth for a mix of apps/diagrams and charts. The possibilities are endless.
Built for Performance & Flexibility
Dual-Mode Rendering
Pure SVG or rich interactive components in your library of choice for maximum flexibility.
Built-in Layouts
Force-Directed, Hierarchical, Balloon, Column, Row and Grid layouts out of the box.
Graph Data Model & Traversal
A graph based data model with built in traversal and value propagation operations and unified chart updates.
Modern Frameworks
Seamless integration with React, Vue, Angular, Svelte and Vanilla JS/TS.
Get a head start
With one of our pre-built templates:
Use VisuallyJs to build a visual Call Flow editor

Use VisuallyJs to create an advanced AI agent builder

Use VisuallyJs to build a Chatbot editor, with actions, messages, input and choices


ERD editor for modelling the steps of a business process

Interactive Gantt chart featuring tasks, task groups and milestones


Uses the classic org chart layout and provides an inspector from which the user can navigate around

Fully featured starter app containing a circuit diagram builder
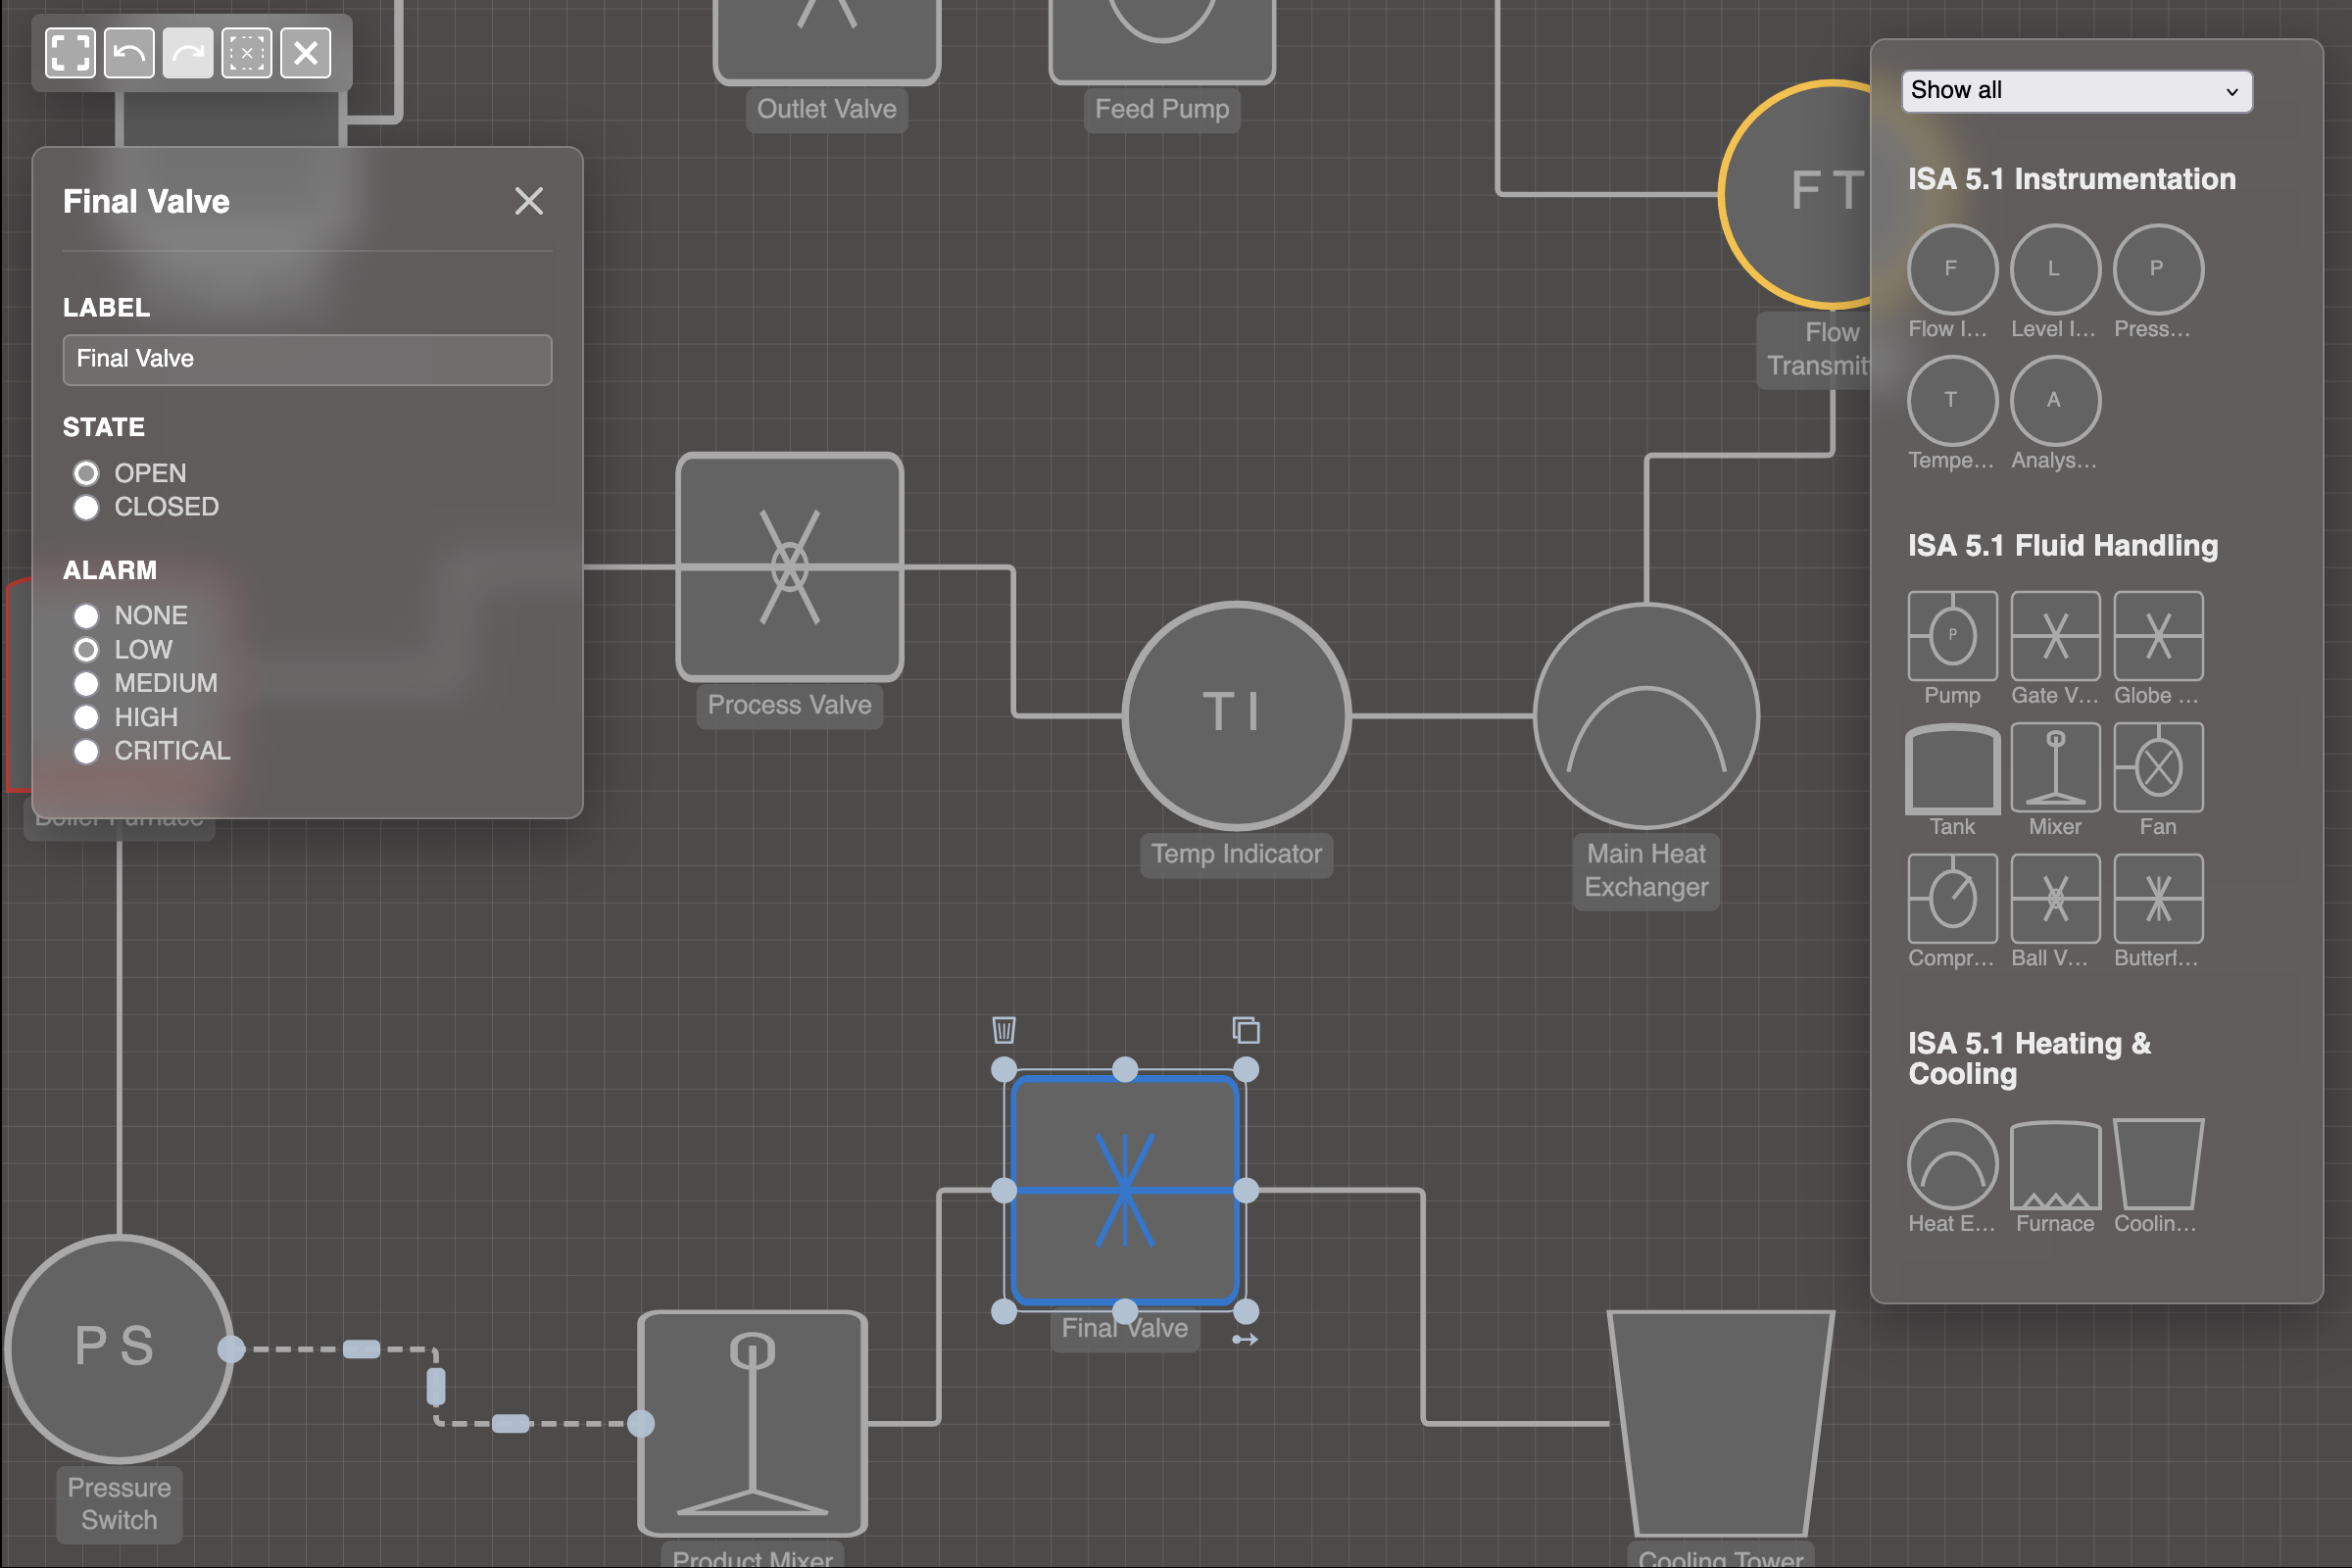


Demonstrates how to include multiple views of a dataset on one page

Fully featured starter app containing a logic gates diagram builder

Basic starter app demonstrating how to setup VisuallyJs and its main features
Use VisuallyJs to create area and line charts

Multiple series, stacked, grouped, pivoted, and much more

Circle, rectangle, triangle or custom markers, multiple series, fully customizable

Use VisuallyJs to create a professional Sankey chart, with support for pivoting
Dashboard for managing and analyzing supply chains

Combine a network management diagram with charts showing projected cost and resource usage


A visualizer for the FIFA World cup - group stages, team journeys and a tournament view.

Combines a fault tree analysis diagram with charts showing risk and list of cut sets
Use VisuallyJs to build a visual Call Flow editor
Use VisuallyJs to create an advanced AI agent builder
Use VisuallyJs to build a Chatbot editor, with actions, messages, input and choices
ERD editor for modelling the steps of a business process
Interactive Gantt chart featuring tasks, task groups and milestones
Uses the classic org chart layout and provides an inspector from which the user can navigate around
Fully featured starter app containing a circuit diagram builder
Demonstrates how to include multiple views of a dataset on one page
Fully featured starter app containing a logic gates diagram builder
Basic starter app demonstrating how to setup VisuallyJs and its main features
Use VisuallyJs to create area and line charts
Multiple series, stacked, grouped, pivoted, and much more
Circle, rectangle, triangle or custom markers, multiple series, fully customizable
Use VisuallyJs to create a professional Sankey chart, with support for pivoting
Dashboard for managing and analyzing supply chains
Combine a network management diagram with charts showing projected cost and resource usage
A visualizer for the FIFA World cup - group stages, team journeys and a tournament view.
Combines a fault tree analysis diagram with charts showing risk and list of cut sets
All the plugins
Miniview

A miniaturized view of your canvas. Pan/zoom via the miniview, and click to scroll
Lasso

Snag a set of nodes and add them to the model's current selection.
Resize Tools

Grow, shrink and rotate vertices, either with visible handles or via the vertex edges
Backgrounds

Grids - with dots or lines - and tiled or static images
Controls

Buttons for common operations such as zoom to extents, undo/redo, etc
Edge Crossings

Mark the intersection of two edges with a bridge or a dot
Drawing

Draw new nodes/groups by dragging the mouse
Snaplines

Visual cues to help align everything just so
Value Propagation
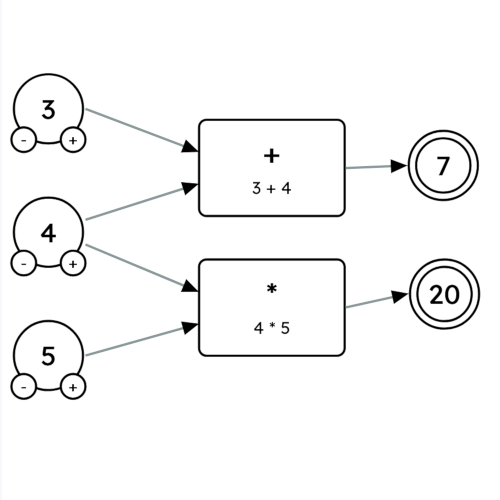
Automatically propagate values through the graph with a declarative API
Pan Buttons

Click to nudge the canvas, or hold to scroll
Scrolling Lists

Automatically park edges on their container when the source/target element is scrolled out of view
and many more...
DISCOVER
DEVELOP
LINKS


INTEGRATIONS

Copyright © 2026 JSPLUMB PTY LTD.